Supplement: Result comparison
This is a supplement to Revisiting Yliluoma's ordered dither algorithm.
Below, the Yliluoma-2 results use a patched version with a 4x4 threshold matrix (the C++ code used a 8x8 one). It also uses N=16 candidates due to the way the code is structured. EMA and Knoll’s algorithms use Euclidean sRGB distances. The “offset” results were created with the grayscale noise method described in the beginning of the article.
kodim21
16 colors and N=16 candidates.








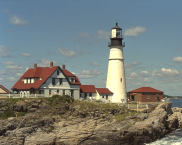
bigbuckbunny_bird
16 colors and N=16 candidate iterations.









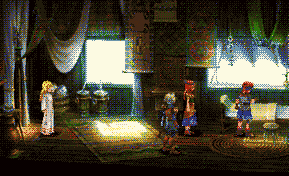
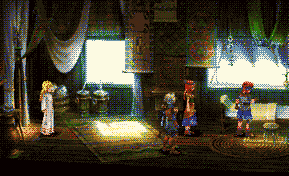
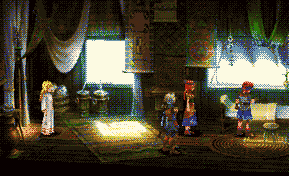
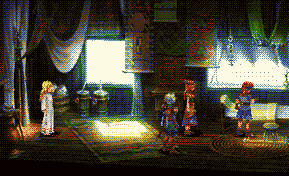
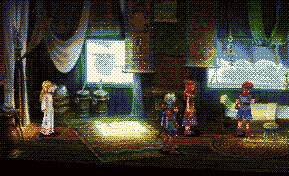
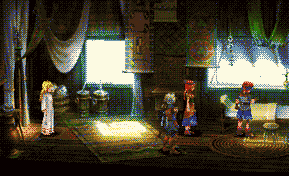
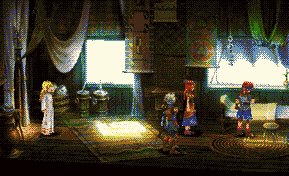
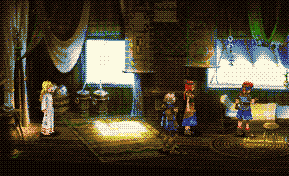
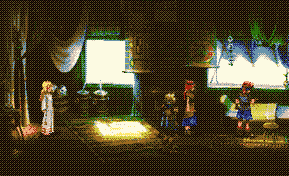
chronocross
16 colors and N=16 candidate iterations. Knoll’s algorithm produces the cleanest result.

kodim23
16 colors and N=16 candidate iterations.
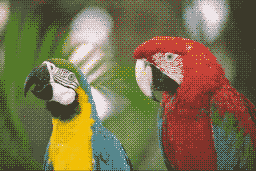
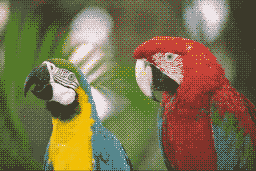
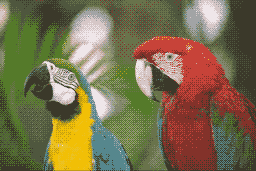
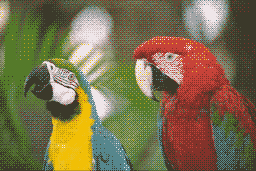
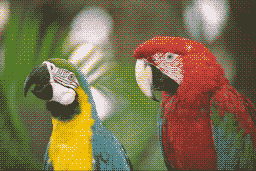
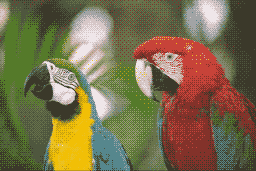
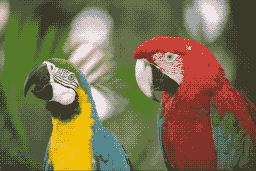
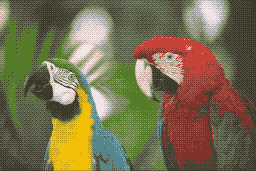
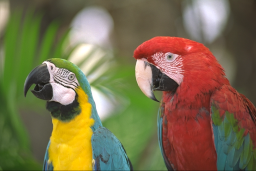
Effect of EMA-Constant’s fixed t value
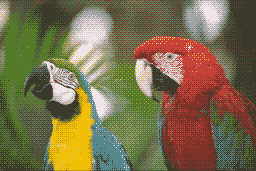
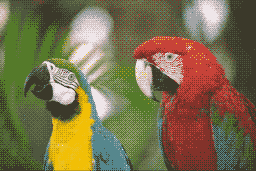
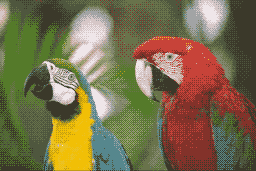
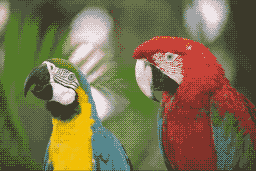
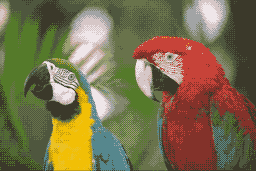
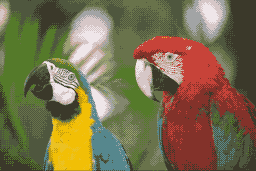
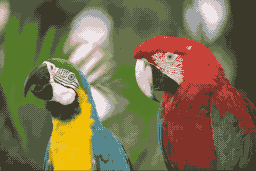
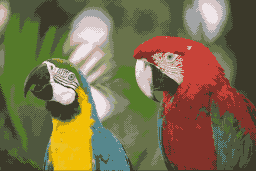
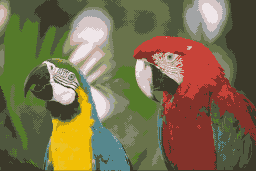
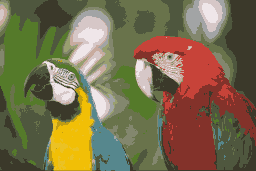
Here is the above Two macaws image dithered with EMA-Constant with a varying values of the constant t. It’s inversely correlated with dither strength.
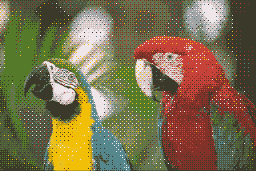
Number of candidates
Below is a comparison of 16-color dithering with EMA-Exact with an increasing number of candidates N.






Luma weighting comparison
Yliluoma-2 is noisy both with and without luma weighting. In this comparison, EMA-Exact and Knoll use libimagequant's RGB weights and gamma.


Linear space comparisons
A low dither strength can look good when zoomed in but if your goal is produce a faithful reconstruction, the results should be judged farther away. Here is a comparison of images computed in linear space (thus Yliluoma-2 is omitted) without magnification so you can judge which looks closest to the original. Make sure your browser’s zoom-level is reset at 100%.
Linear-space “kodim21”
16 colors, N=32 candidates. Knoll’s algorithm at a high 80% strength produces many stray pixels. Offset is too desaturated. The rest look similar.





Linear-space “chronocross”
16 colors, N=16 candidates. EMA-Exact and EMA-constant are almost on par with Knoll but both produce stray pixels (see the top and right edges).
Appendix: Artifical 2D test case
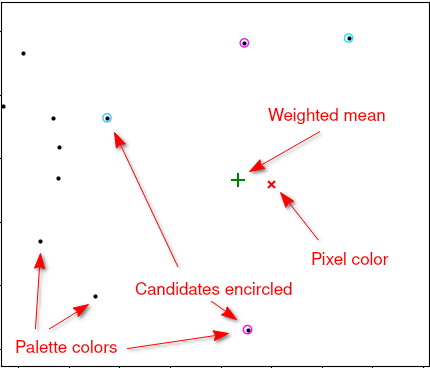
The candidate weights Knoll’s algorithm calculates give a weighted mean almost exactly on the input point \mathbf{p}. In contrast, the EMA sweep of Yliluoma-2 doesn’t fare as well. In the below diagrams black points represent palette colors, the red X the input color \mathbf{p}, the green + sign the weighted mean of the chosen candidate points (circled in color).
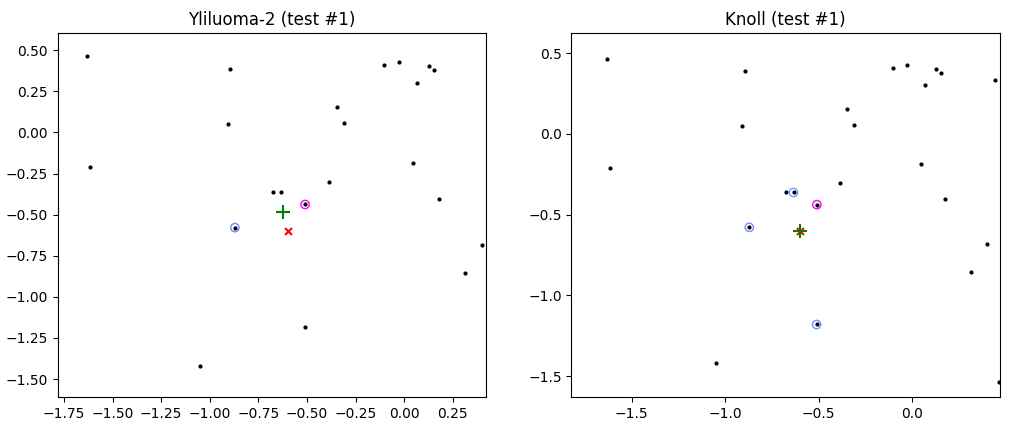
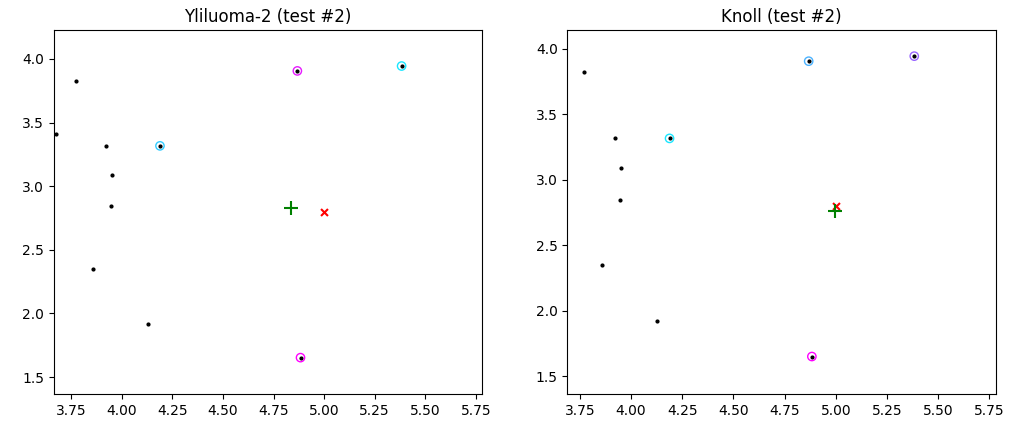
Also here’s a visual legend to the above diagrams: